Simple Linear Regression from Scratch with Python
Linear regression machine learning model from scratch without using any machine learning libraries.
Simple Linear Regression Project
In this project, we are going to make a linear regression machine learning model from scratch without using any machine learning libraries. We will create a simple data set and train the model using this data set. Then we will do the prediction on the data set to see the accuracy of the model.
Data Set
Let us creat a small simple data set first and assign the columns to x and y values. x will be used as feature column and y will be used as target column.
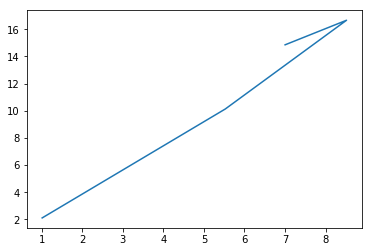
data = [[1.0100, 2.1122], [5.5277, 10.1302], [8.5186, 16.6620], [7.0032,14.8540]]
x = [row[0] for row in data]
y = [row[1] for row in data]
Let us plot the data set to vizualize.
import matplotlib.pyplot as plt
%matplotlib inline

plt.plot(x,y)
plt.show()
Create Model
Simple linear regression formula
DEFINITIONS:
b1 - This is the SLOPE of the regression line. Thus this is the amount that the Y variable (dependent) will change for each 1 unit change in the X variable.
b0 - This is the intercept of the regression line with the y-axis. In otherwords it is the value of Y if the value of X = 0.
y = b0 + b1(x) - This is the sample regression line. You must calculate b0 & b1 to create this line. Y-hat stands for the predicted value of Y, and it can be obtained by plugging an individual value of x into the equation and calculating y-hat.
y = b0 + b1*x
B1 = sum((x(i)-mean(x)) * sum((y(i)- mean(y)))) / sum((x(i)- mean(x))^2)
B0 = mean(y) - B1*mean(x)
So we need to find Mean, Variance and Co-variance to calculate Co efficients b1 & b0
Mean
# mean(x) = sum(x)/ count(x)

def mean(values):
    return sum(values)/float(len(values))
Variance
#variance = sum( (x - mean(x))^2 )
def variance(values, mean):
    return sum([(x-mean)**2 for x in values])
Let us check the mean and variance for our data set
mean_x, mean_y = mean(x), mean(y)
var_x, var_y = variance(x, mean_x), variance(y, mean_y)
print('x stats: mean=%.3f variance=%.3f' % (mean_x, var_x))
print('y stats: mean=%.3f variance=%.3f' % (mean_y, var_y))
x stats: mean=5.515 variance=31.532
y stats: mean=10.940 variance=126.647
Co Variance
# covariance = sum((x(i) - mean(x)) * (y(i) - mean(y)))
def covariance(x, mean_x, y, mean_y):
    covar = 0.0
    for i in range (len(x)):
        covar += (x[i]- mean_x)* (y[i]-mean_y)
    return covar
covar = covariance(x, mean_x, y, mean_y)
print ('covariance:%.3f' % (covar))
covariance:62.770
Co efficients - B0 and B1
B1 = sum((x(i) - mean(x)) * (y(i) - mean(y))) / sum( (x(i) - mean(x))^2 ) so we can simplify it to B1 = covariance(x, y) / variance(x)
AND
B0 = mean(y) - B1 * mean(x)
def coefficients(data):
    x = [row[0] for row in data]
    y = [row[1] for row in data]
    x_mean, y_mean = mean(x), mean(y)
    b1 = covariance(x, x_mean, y, y_mean)/variance(x, x_mean)
    b0 = y_mean - b1 * x_mean
    return [b0, b1]
b0, b1 = coefficients(data)
print (' coefficients: B0=%.3f, B1=%.3f' % (b0, b1))
coefficients: B0=-0.039, B1=1.991
Make Predictions
# Make predictions
# y = b0 + b1 * x

def simple_linear_regression(train, test):
    predictions = list()
    b0, b1 = coefficients(train)
    for row in test:
        yhat = b0 + b1 * row[0]
        predictions.append(yhat)
    return predictions
simple_linear_regression(data, data)
[1.9716689323220757, 10.96513094501911, 16.919166302341544, 13.902433820317263]
Evaluate Model
Finally, we need to check the accuracy of our model. So we will calculate the root mean squared error.
from math import sqrt

# Calculate root mean squared error
def rmse_metric(actual, predicted):
    sum_error = 0.0
    for i in range(len(actual)):
        prediction_error = predicted[i] - actual[i]
        sum_error += (prediction_error ** 2)
    mean_error = sum_error / float(len(actual))
    return sqrt(mean_error)
We will evaluate the algorithm on training test first
# Evaluate regression algorithm on training dataset
def evaluate_algorithm(dataset, algorithm):
    test_set = list()
    for row in dataset:
        row_copy = list(row)
        row_copy[-1] = None
        test_set.append(row_copy)
    predicted = algorithm(dataset, test_set)
    print(predicted)
    actual = [row[-1] for row in dataset]
    rmse = rmse_metric(actual, predicted)
    return rmse
rmse = evaluate_algorithm(data, simple_linear_regression)
print('RMSE: %.3f' % (rmse))
[1.9716689323220757, 10.96513094501911, 16.919166302341544, 13.902433820317263]
RMSE: 0.650
Now we will evaluate our model on new data set to check the accuracy of our model on unseen the data.
# Test simple linear regression
dataset = [[1, 1], [2, 3], [4, 3], [3, 2], [5, 5]]
rmse = evaluate_algorithm(dataset, simple_linear_regression)
print('RMSE: %.3f' % (rmse))
[1.1999999999999995, 1.9999999999999996, 3.5999999999999996, 2.8, 4.3999999999999995]
RMSE: 0.693
You can see that RMSE value on both known and unknown data sets are almost equal. But slightly higher on new data
Lower values of RMSE indicate better fit.
This indicates that our linear regression model is OK. This model can be improved with further training and gradient descent function
